Statistics, Python, Making a Stem Plot

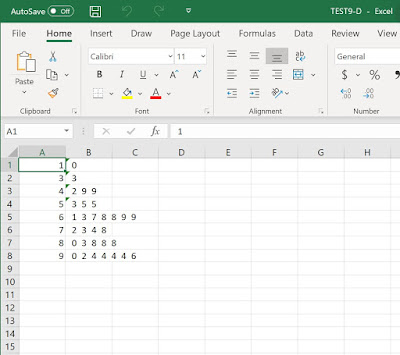
I'm doing homework, and the book is covering Stem plots. Well when I looked up stem plots, there were tons of options. Look at MatPlotLib's stem plots: https://matplotlib.org/3.1.1/api/_as_gen/matplotlib.pyplot.stem.html I mean. Wait wait wait.... My book has something like this: STEM LEAF 1 2, 3, 4 2 5, 6, 8 3 1, 3, 5 So, what do I do when I can't visualize the data? I code. And I glue it inside my teflon brain with that code. This is how I learn, but it isn't necessarily how any one else does. Pictures: top= picture of excel file with stem plot. bottom= picture of stem plot printed i...
