Posts

Showing posts from 2019

Setting up the Javascript Experiment part 3: the Search

Image
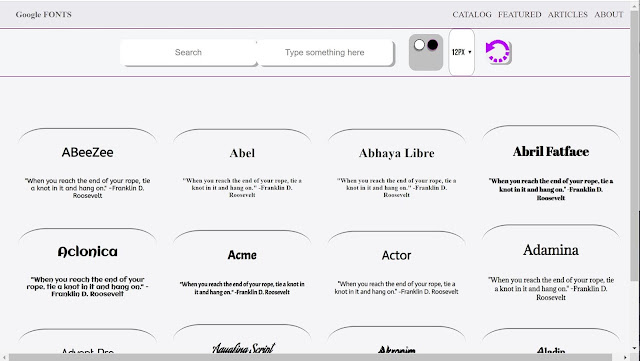
Where ya been Nellie? I had the code working and written up for this part of the blog for a bit now, but wanted it incorporated into the finished app so the readers can see it in action before looking over the code. Image: screenshot of Favorite Fonts Chingu prework project.  Much like google fonts catalog page, it will allow you to surf through, search through, and play with different fonts available through the google fonts API. The full github repo: https://github.com/nelliesnoodles/Favorite_Fonts_Chingu_V15_prework Try it out! https://nelliesnoodles.github.io/Favorite_Fonts_Chingu_V15_prework/ The reason: Once I had the search algorithms worked out, there wasn't a whole lot of modification that needed to be done to work it into the javascript file for my favorite fonts project.  And since I had played with it and worked it thoroughly in the Experiment, I could see where different elements of the project needed to be included and modified to make the search wo

Setting up the JavaScript Experiment, Part 2

Image
What we did first: https://camelcasenoodles.blogspot.com/2019/12/setting-up-javascript-experiment.html What's Next: Now we need to start setting up a search algorithm.  The user will type into the Search input and look for a matching word/string.   For this part, we are only going to get it finding strings who's first letters match and giving us back a list of those matches in the console with console.log. You can see what the log is doing if you go to your developer tools in the browser and opening up the tab for console.   Pictured below is what those steps are with Chrome.  On firefox they are very similar steps. Step 1:  find the tools Usually in the top right corner next to the address bar Step 2:  Open web development in the list,  In chrome, it is linked to the first menu's "more tools" list item.  Image: The open tools, with the drop menus for 'more tools' and 'development tools' selected. Step 3: Select the Develope

Setting up a Javascript experiment.

Image
Setting up a JavaScript Experiment Whenever I do an experiment for JavaScript, I set up an html file, and a javascript file. *The css file is just because I want it to be pretty, totally optional, but don't go overboard it isn't necessary for the experiment* Pictured below is the current project I'm working on, and I need to figure out how the 'Search' input works in google fonts.  I'm not going to be able to duplicate what google does to make this happen, so I need to find a way to do it myself.  I'm clueless as I write this, but that is where the experiment comes in. With Python, I'd run all the experiments in the command prompt / powershell / terminal.  Python does what it's gonna do in the system, that is where the process is run.  *Let's ignore Django exists yeah? Javascript on the other hand will have different reactions in a Browser, because the browser carries out it's own rules and interpretation of the code then t

Python, a map, and a maze

Image
Python terminal maze So I was browsing the Learn Code the Hard Way Forum and came across the concept of making a map of x y coordinates, and realized I've never actually attempted something of that nature. So,  I fired up that Visual Studio Code ,  and had at it.  I'm trying to figure out why I've never attempted it before.  I think I might have just decided I wasn't ready for it and skipped on to less complicated things,  but today I really could see the fun in making a maze.  While running this prompt, for screen readers, to turn off the ascii just comment out the print_ascii() calls before and in the while loop. *The ascii map as imaged above may not print pretty in your command/terminal if the font is not the same as mine.  Change it however you want.* There are a ton of things you could modify and change.  For example, adding a system clear screen so that the map and instructions only appear at the top. You could add ascii colors, or shapes with a

python statistics normal distribution continuous density

Image
Normal Distribution: Stats Class Code. Colorful wind chimes of bells and clay I was attempting to write the different formula's I would need for a normal distribution curve and the calculations we'd need for class.  There is a bit of success and a bit of failure in the code.  I may tweek it a bit more, so that someone could enter the a and b,  size of the curve, and the area range they want and it does the deviation, and mean calculations also, but this is enough for now. As always, drop a comment if you see anything wrong, or that needs improvement.  Take the code, practice, break it, build it, have fun learning. Lessons learned: Now for this bit of code, I was sure I could use the formula I found in this Khan video to write my own python function to find the probability in a range under a curve. Turns out, no, the math is way more complex for a continuous function. I am leaving my function and the way it uses the formula in the code block. I made an effo

Binomial deviation, mean, expected value, python Statistics class

Image
Binomials Deviation, Mean, Expected Value A pair of elder hands counting/sorting coins Another stellar explanation by this Khan Academy teacher: https://www.khanacademy.org/math/ap-statistics/random-variables-ap/binomial-mean-standard-deviation/v/finding-the-mean-and-standard-deviation-of-a-binomial-random-variable The code has comments, but I highly encourage watching the referenced video for understanding.  I still have to look up these Bernoulli variables, and maybe check out doing something pythonistic for that too.    So not much commentary on todays blog. GIMME THE CODE --start code block-- # Binomial mean, deviation import math import sys # reference= https://www.khanacademy.org/math/ap-statistics/random-variables-ap/binomial-mean-standard-deviation/v/expected-value-of-binomial-variable # Binomail random variable X, is understood as: # 1) A sample set is finite # 2) The success and fail probabilities are constant, they do not change

Stats class, binomial distribution Python

Image
A little background: For my statistics class at the local community college, the teacher has us plug numbers into Excel to get answers, because well, we don't need to learn to do the formula. I may be kinda a stickler about knowing the formula, while it's great Excel has a way to just plug in the numbers, I need to see the math.  I need to see and understand what's going on. I'll come back for more testing on this, and more explanation.  The link below for khan academy will do a far superior job at explaining the math than I can. Links I don't know about you all, but when I looked at the SciPy and Numpy links, I had a hard time following.  Also, the formulas and methods I found return an array or an object.  I just need the result of that big hairy formula.  I must not be googling correctly.  If anyone can link me to the method in either one of these that just returns the results of that binomial distribution formula, it'd be much appreciated.  *

Python, excel, pandas, write an excel file to a panda's database

Image
Using Python, Pandas and Excel to create my database I started writing a new set of python class's for the machine learning experiment. With the original code I found that I was coding all the decisions that were being made.  Now while it functioned fine, the point of getting the machine to do the work was lost. So the new one started trying to figure out how to make it quicker, reusable, and the data modifiable. The decision tree needed something to work with besides the hard coded solution.  This is where pandas and excel will come in. Below the bad descisions section is the new code.  Feel free to scroll down if that's what your here for. Image: Pandas in action. Compacted terminal print of the columns of data labeled: size, seed_type, [...], ornaments, colors, names.   The rows are identified by number only.  1 - 8.  These identifiers in the column will help the new decision tree eliminate what plant we are describing down to a list of names that fits for size, s